The recent rains have prompted questions about "what does this mean for the drought" in California. The short answer is that while every inch of rain helps, the deficits over the past 4 years will not be easily mitigated.
The total 4-year deficits from normal, range from about 1 to 1.5 seasons worth over Northern California, to between a 1.5 and 2.0 season deficit in the central interior, while generally south of the Tehachapis there is a 2 season deficit. This means that for a location with a 1.5 season deficit to erased next year, that location would need 250% of normal rainfall.
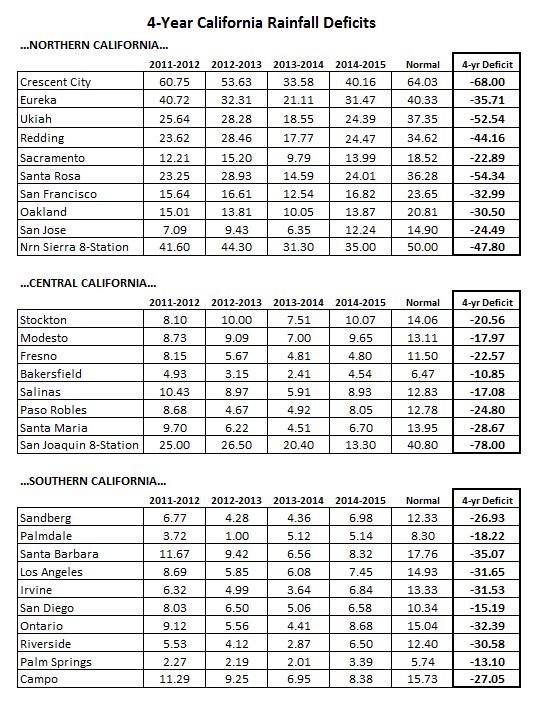
Note: The 2014-15 totals above only reflect rainfall through April 5th and any additonal rainfall between now and the end of June would go toward reducing the deficit.
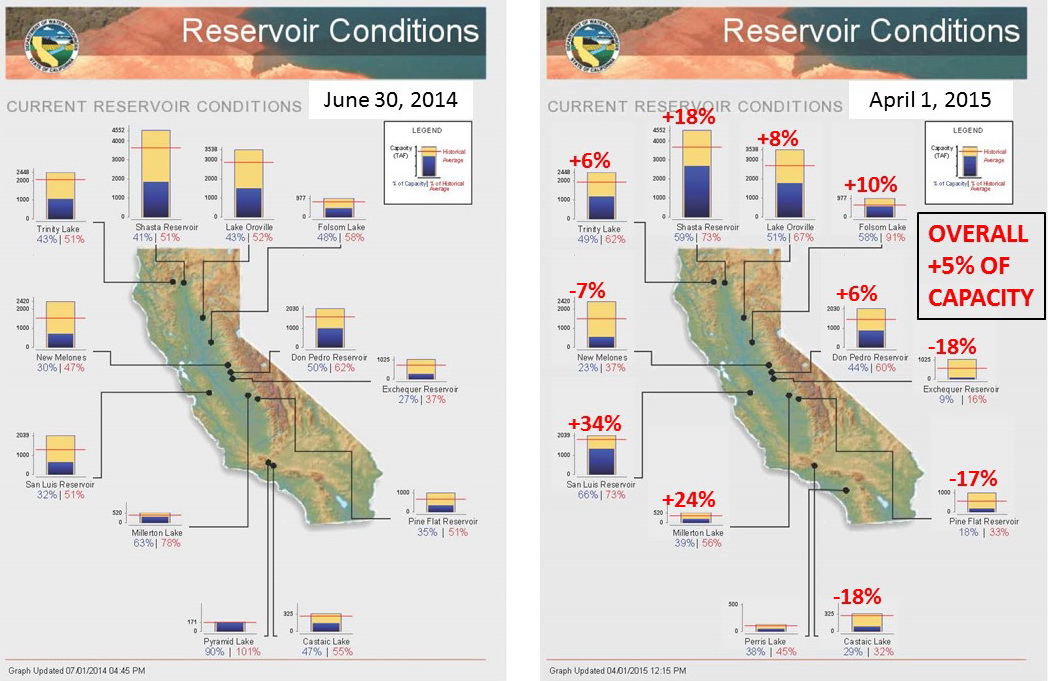
An even more important caveat to the above is that this table is based only on rainfall deficits while drought mitigation for California is further complicated by a host of other factors including reservoir levels, groundwater levels and water usage.
Jan Null, CCM
Golden Gate Weather Services